Follow us


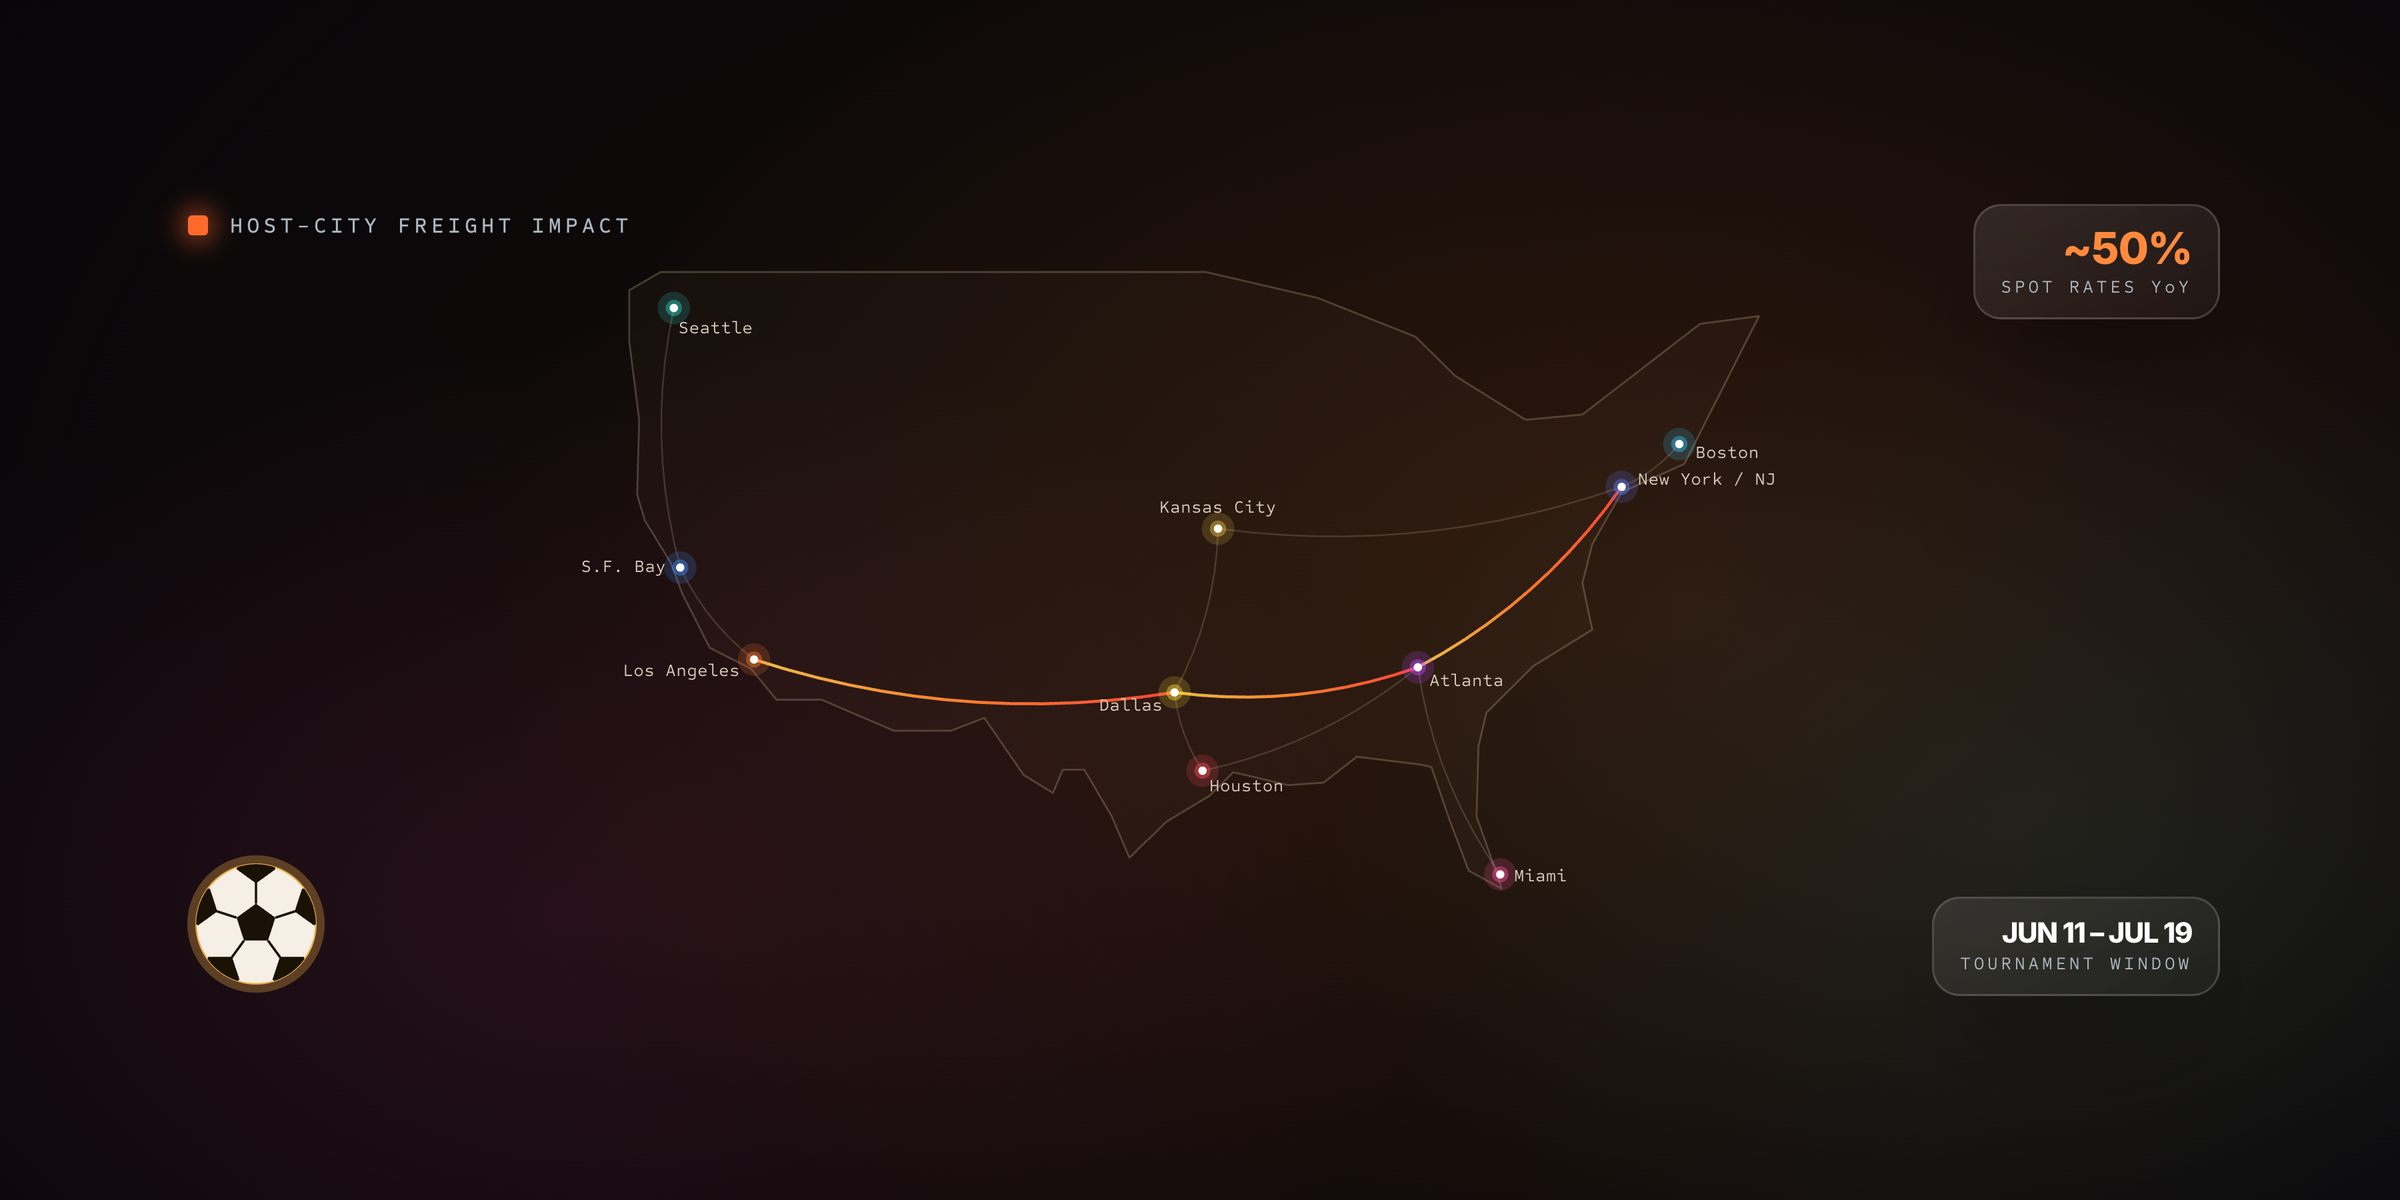
The 2026 FIFA World Cup is moving thousands of truckloads of equipment, merchandise, and food across 16 host cities while tightening truckload and reefer capacity in the country's busiest freight corridors. For shippers running lanes through Dallas, LA, New York, Miami, Atlanta, or Seattle, the result is higher spot rates and more tender rejections through mid-July.
The 2026 FIFA World Cup started June 11. If you're moving freight through Dallas, Los Angeles, New York, Miami, Atlanta, or Seattle, it's already affecting your rates and capacity, whether you're thinking about it or not.
The tournament runs 104 matches across 16 host cities in the U.S., Canada, and Mexico through July 19. Most shippers are focused on the spectacle. The supply chain reality is less glamorous and a lot more operational.
More than most people realize. Rock-it Cargo, the Official Logistics Provider for FIFA World Cup 2026, projected it would deploy more than 5,000 trucks and vehicles, occupy approximately one million square feet of warehouse space, and manage more than one million pounds of equipment across 16 stadiums in three countries.
That's before you count a single case of food or beverage.
The 2018 World Cup required roughly 36 truckloads just to move central broadcast and production equipment, supporting 34+ cameras per stadium, 1,000 monitors, and more than 53,000 individual cable pieces for technical operations alone. The 2026 edition operates across three countries for the first time and is billed as the largest FIFA World Cup ever organized. The broadcast and infrastructure footprint scales accordingly.
And that's the organized, planned freight. The more relevant number for most shippers is what the event does to the freight they already run.
The cities hosting matches aren't random. Dallas, Los Angeles, New York/New Jersey, Miami, Atlanta, Houston, Seattle. These are the country's highest-volume freight corridors. The World Cup didn't choose them by accident, but neither did your routing guide.
Here's what's already in play:
Capacity is tighter around match periods. Hospitality, food service, and retail replenishment are all competing for the same truckload and reefer capacity in these markets. When millions of visitors arrive in a short window, restaurant and hotel supply chains spike. That demand doesn't come from nowhere. It pulls capacity off lanes that were already committed to other freight.
Road closures ripple outward from stadiums. The Trucking Association of New York launched a dedicated World Cup Resource Hub to help carriers navigate road closures, restricted access zones, and congestion across the metro area, with truck delivery restrictions confirmed for six hours before and three hours after each match at MetLife Stadium. That policy, replicated across 16 venues in major metro areas, creates access windows that collapse fast. Carriers routing near those corridors feel the friction whether their load is anywhere near the venue or not.
Spot rates are already elevated heading in. According to FTR Transportation Intelligence and DAT Freight & Analytics via FleetOwner, average spot rates across all three major trailer types are running approximately 50% higher year-over-year. The World Cup is adding demand pressure on top of a market that was already tightening. Dallas is running above forecasted levels; the Northeast has seen the largest regional worsening. The event lands in the middle of an already stressed market, not a soft one.
If you're seeing tender rejections on lanes through these corridors, that's the combination at work.
If your routing guide was built on last year's rates, the lanes running through World Cup host cities are the ones most likely to come back rejected. Contract rates that made sense in Q1 look different when a carrier has spot options opening up around a major event in LA or Miami.
The shippers who will manage this window cleanly are the ones who can see what's happening at the lane level in real time, and who have enough carriers in play to absorb a rejection without scrambling. This is exactly the problem a broad carrier network and live rate benchmarking solves.
That's not a new problem. It's the same problem that shows up every time an external event stresses one corridor. The World Cup is just bigger and more concentrated than most.
A few things worth doing before the next match cycle:
Check your route guide depth on lanes touching the 11 U.S. host cities. Atlanta, Dallas, Houston, LA, Miami, New York/New Jersey, Kansas City, Seattle. If your primary and backup carriers on those lanes are thin, you'll find out the hard way. Carrier scorecards that track response and acceptance rates by lane give you a clear read on where you're exposed before a rejection forces the issue.
Look at your reefer exposure. Food and beverage is the category under the most World Cup-driven demand pressure. Temperature-controlled capacity near host cities is tightening faster than dry van. If you move refrigerated freight into any of these markets, quote more carriers than you think you need right now.
Run a spot quote before you need one. If you haven't checked what the market rate looks like on a World Cup corridor lane recently, you're managing on old information. The gap between what your contract says and what the market is doing right now can be significant, and a lane-level benchmark shows you exactly where you stand before a carrier tells you.
If your carriers are already telling you rates need to move, they're probably right, and they know about the next several weeks of event calendar better than your routing guide does.
Major events compress demand into narrow geographic windows. The shippers who handle it well aren't necessarily the ones who predicted it earliest. They're the ones with procurement tools that let them see the market clearly and move fast enough to act on it.
If you're running freight through these corridors over the next five weeks on annual contract rates with three carriers, you're operating on a routing guide that wasn't built for this market. The true cost of quoting freight in spreadsheets and emails gets a lot more visible when the market is moving this fast.
Which cities are hosting the 2026 World Cup?
The tournament spans 16 host cities across three countries. The 11 U.S. host cities are Atlanta, Boston, Dallas, Houston, Kansas City, Los Angeles, Miami/Miami Gardens, New York/New Jersey, San Francisco Bay Area, and Seattle. Canada hosts in Toronto and Vancouver; Mexico hosts in Guadalajara, Mexico City, and Monterrey. Several of the U.S. cities sit on the country's busiest freight lanes.
Why does the World Cup affect shippers who aren't moving event freight?
Because the demand and the disruption hit shared infrastructure. Hospitality and retail replenishment pull truckload and reefer capacity off lanes that were already committed elsewhere, and road closures around stadiums slow every carrier routing through those corridors, not just the ones delivering to the venue.
How long will the freight impact last?
Expect pressure through the tournament window of June 11 to July 19, concentrated around match days in each host city. Capacity in the busiest corridors is likely to stay tight for the duration rather than spiking and resetting between matches.
What can I do to protect my lanes during the World Cup?
Check route guide depth on lanes touching host cities, watch reefer exposure most closely, and benchmark your rates against the live market before you book rather than relying on contract rates set earlier in the year.
You can't move the World Cup off your lanes. But you can see it coming.
The shippers who get through the next five weeks without paying peak prices aren't the ones who guessed right. They're the ones who can read the market at the lane level and have enough carriers in play to move when a rate does.
See how Emerge's Rate Pulse benchmarks your lanes against real-time market conditions.
Ready to reinvent your procurement strategy?