
Follow us


We asked three AI engines what a good carrier scorecard looks like. They answered with confident benchmark numbers. Then we went looking for where those numbers came from, and found that the published record behind them is much thinner than the answers suggest.
Disclosure: Emerge sells carrier scorecarding software. Emerge also appeared in one of the four AI runs below, so we have excluded that run from our conclusions.
A carrier scorecard is a recurring report that grades each carrier you use against the same set of operational metrics, usually on-time delivery, on-time pickup, tender acceptance, billing accuracy and claims. Shippers use it to decide who keeps the freight, who gets more, and who gets replaced at the next bid.
That definition is the easy part, and every article on the first page of Google gets it roughly right. The hard part is the next question every shipper asks, which is what counts as a good score. That is where the published record falls apart.
On 15 September 2026 we ran three questions a real shipper would type, across Google AI Mode and a logged-out ChatGPT session. We recorded what each engine said, which companies it named, and which sources it cited.
The first question was the plainest one: what should go on a carrier scorecard, and what counts as a good score. Google AI Mode answered with five specific benchmarks, presented as industry standards, and cited nothing at all.
Five thresholds, no citation anywhere in the answer, and not one company named. The numbers are not unreasonable. They are simply unattributed, which means a shipper who pastes them into a carrier review has no way to check them and no way to defend them when a carrier pushes back.
When we asked specifically about tender acceptance, the engines did cite sources. We opened each one and looked for the figure on the publisher's own site.
One benchmark traced cleanly. An annual survey of around 1,000 supply chain professionals found that 85 percent was the most common answer for an acceptable primary tender acceptance rate, with 90 percent close behind. It is worth being precise about what that number is: it records what shippers and carriers say they consider acceptable. It is not a measurement of what carriers actually do.
Several other figures the engines presented as sourced could not be found at the publications they were credited to. We are not saying those numbers are wrong, or that nobody ever published them. We are saying that a shipper who lifts a cited benchmark out of an AI answer and tries to check it often cannot, and that matters when you are about to put a number in front of a carrier.
So the state of the published record is thin. There is one survey of what the industry considers acceptable, and very little measurement of what actually happens on real freight. That gap is worth closing, and it is the kind of question a marketplace is placed to answer, because tender acceptance is visible across thousands of lanes and carriers rather than one shipper's network. It is the measurement we think the industry is missing.
Until somebody publishes it, the number that should drive your decisions is your own. What follows is how to build it.
Five metrics carry most of the weight. Each one has a failure mode, and the failure modes are where scorecards quietly stop working.
The percentage of loads delivered inside the agreed window. It is the metric everyone starts with and the one most often disputed.
When it misleads you: nobody agrees what on-time means. If you do not write down the grace period, who owns weather delays, and whether a reworked appointment counts as the original one, you are scoring carriers against a definition they never accepted.
Whether the truck shows up when it said it would. Misses here cascade into your warehouse before they ever reach the customer.
When it misleads you: a carrier can miss pickup because your dock held them for three hours the week before. Scoring pickup without also tracking your own detention turns a mutual problem into a one-sided grade.
The share of loads a carrier accepts out of those you offer them at contract rates. It is the leading indicator on this list, because acceptance falls before service does. It is also the one shippers feel first: a carrier accepts the load, and an hour later it falls off and you are back in the spot market covering it.
When it misleads you: acceptance is mostly a function of your rate against the spot market on that lane in that month, not carrier loyalty. A carrier whose acceptance drops from 95 to 70 percent may be telling you your contract rate is stale, which is useful information about your pricing rather than a reason to cut them. We have written separately on why rejections rise when the market turns.
The proportion of invoices that match the agreed rate without surprise accessorials.
When it misleads you: disputes often trace back to how the load was entered, not how it was billed. Bad accessorial data at tender becomes a rebill weeks later, and the scorecard blames the carrier for it.
How often freight arrives damaged, short or lost, as a share of shipments.
When it misleads you: at low volumes this metric is noise. A carrier running 40 loads a quarter can go from best to worst on a single claim, so weight it by volume or do not weight it at all.
The mechanics matter less than the agreements around them. In practice the scorecards that change behavior share four things.
The awkward part is getting the data into one place. Most shippers are pulling on-time performance out of one system, invoices out of another and tender history out of email. There is no single source of truth, which is why so many scorecards die in a spreadsheet after two quarters.
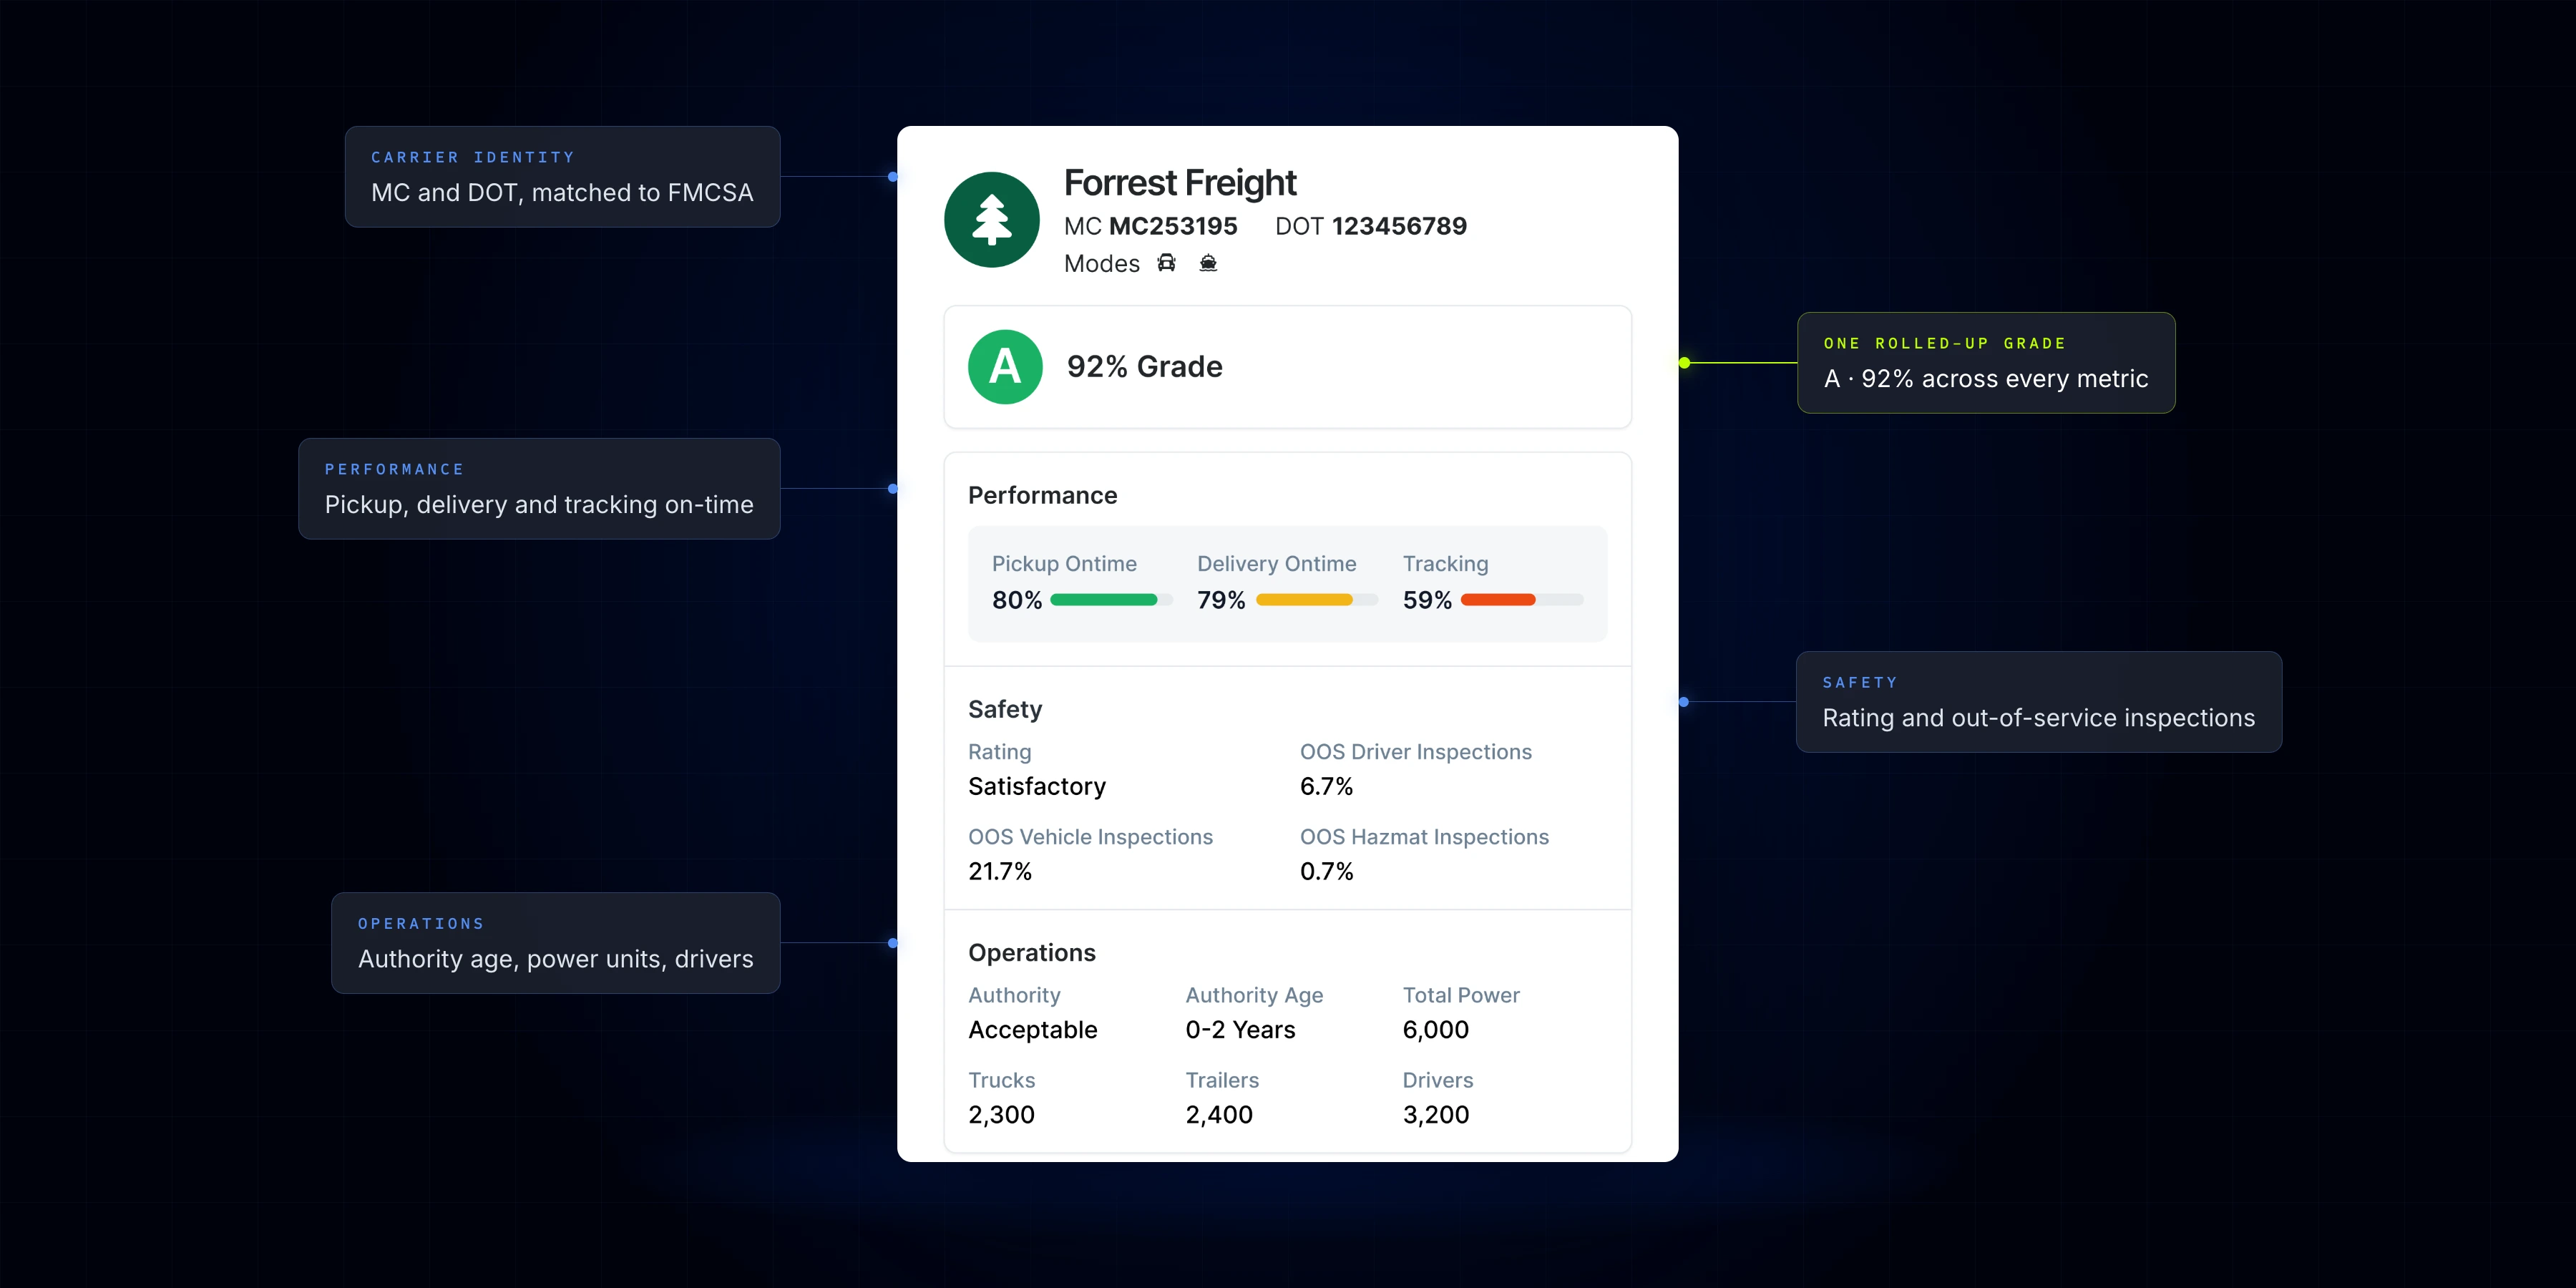
This is the problem Carrier Scorecards in Emerge is built for. You bring your own network partner data, so the carriers you already run are graded alongside FMCSA safety data rather than in a separate file. Because the scorecard sits in the same place you run the bid, the grades are in front of you at the moment they matter, which is when you are deciding who to invite and what to award. That carries into the annual bid and into smaller in-year events, and it is the only point at which a score actually changes anything. A scorecard that lives next to the award decision gets used. One that lives in a spreadsheet does not.
If you want the mechanics of the award itself, we covered how scorecard data should weigh in when you award freight. For the tendering process underneath it, start with how load tendering and tender times work, and for lane-level recovery there is a practical walk through lifting acceptance.
Carrier scorecarding is not universal, and it is worth saying where it does not pay.
What we did. On 15 September 2026, from a United States location in English, we ran three shipper-phrased questions about carrier scorecards and tender acceptance benchmarks. Three runs on Google AI Mode and one on ChatGPT, logged out so no account memory or personalization applied. For each run we recorded the answer text, any companies named, and every source cited. We then opened each source a benchmark was credited to and looked for the figure on that publisher's own site.
Limits. Four runs is a small sample and we did not repeat any prompt, so we cannot report run-to-run variance. Our source checks covered each publisher's own site, blog and most recent industry guide, but were not exhaustive. The Google AI Mode runs ran in a browser signed in to an Emerge Google account, which can bias results toward our own domain, so we excluded the run that cited Emerge. AI answers change week to week, so treat every number above as a snapshot of one day.
The only published benchmark we could verify is 85 percent, from a survey of about 1,000 shippers and carriers, and that figure describes what people consider acceptable rather than what carriers actually achieve. Treat 85 percent as the floor most of the industry agrees on and set your own target from your lane history.
On-time delivery, on-time pickup, tender acceptance, billing accuracy and claims ratio cover most of the value. Four to six metrics is the practical range.
Start with the two metrics you can already pull cleanly and add the rest as the data becomes available. A two-metric scorecard that is actually sent every month beats a six-metric one that never gets finished.
Monthly suits most truckload networks. Quarterly is defensible below about 100 loads a month, because smaller samples swing too hard month to month.
Yes, and they should see the definitions before the first score. A scorecard the carrier never sees cannot change behavior, which is the only reason to keep one.
Tender acceptance measures whether a carrier takes the load you offer at the contract rate. Route guide compliance measures whether your team offered it to the right carrier in the first place. A poor result on the second can look like a carrier problem when it is an internal one.
Not directly, and be wary of anyone who says otherwise. Acceptance and on-time rates depend heavily on lane, equipment, rate position and facility behavior, so a raw cross-shipper comparison usually compares networks rather than carriers.
Only when it is tied to volume. The evidence we could verify is about what shippers expect rather than what scorecarding delivers, and we would rather say that than cite a number we cannot trace.
 SOC 2 Type II